Definition of Z-Score
A Z-score is a statistical measurement that describes a value’s relationship to the mean of a group of values. It indicates how many standard deviations an element is from the mean. In simpler terms, the Z-score tells you how unusual or typical a particular data point is compared to the average of the dataset.
Meaning of Z-Score
Z-scores are used in statistics to identify outliers, assess probabilities, and compare different data sets. A Z-score can be positive or negative:
- Positive Z-Score: Indicates that the data point is above the mean.
- Negative Z-Score: Indicates that the data point is below the mean.
- Z-Score of Zero: Indicates that the data point is exactly at the mean.
Z-scores help to standardize different data sets, making it easier to compare scores from different distributions or groups.
How Z-Score Works
The Z-score helps to determine how far a data point is from the mean by measuring it in terms of standard deviations. Here’s how it works:
Identify the Mean and Standard Deviation:
The mean represents the average of the dataset, while the standard deviation measures the spread of the data points around the mean.
Calculate the Z-Score:
The Z-score formula is:
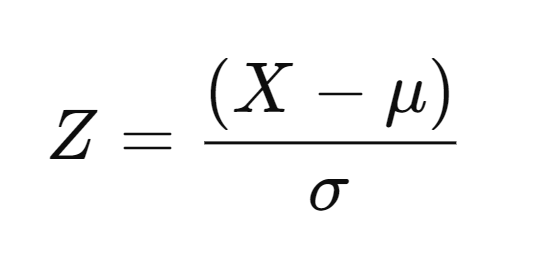
- X is the value for which you want to calculate the Z-score.
- μ (mu) is the mean of the dataset.
- σ (sigma) is the standard deviation of the dataset.
Interpret the Z-Score:
- Z = 0: The value is exactly at the mean.
- Positive Z-Score: The value is above the mean (e.g., a Z-score of 2.0 means it’s 2 standard deviations above the mean).
- Negative Z-Score: The value is below the mean (e.g., a Z-score of -1.5 means it’s 1.5 standard deviations below the mean).
The Z-score standardizes data, allowing easy comparison between different data points, regardless of the units of the original data.
What Z-Score Means for Investors
In finance, Z-scores are used to evaluate the risk and performance of stocks, funds, or companies, helping investors make informed decisions.
1. Assessing Stock Volatility:
- Z-scores help investors assess how volatile a stock is compared to its historical average.
- For example, if a stock has a Z-score of +2, it means the stock is trading significantly higher than its historical average, indicating overperformance. A Z-score of -2 suggests underperformance.
- Investors can use this information to identify unusually high or low prices, helping in decision-making regarding buying or selling.
2. Identifying Market Outliers:
- Z-scores can highlight stocks or securities that are behaving unusually compared to the broader market. A stock with a very high positive or negative Z-score may indicate that something unique is happening with that company, which could signal opportunity or risk.
- For instance, a Z-score significantly higher than 2 or lower than -2 could point to potential overvaluation or undervaluation, prompting deeper analysis.
3. Evaluating Financial Health (Altman Z-Score):
- The Altman Z-score is a version of the Z-score that predicts the likelihood of a company going bankrupt. It uses financial data like profitability, leverage, and liquidity to generate a score.
- A Z-score above 2.99 indicates low risk of bankruptcy.
- A Z-score below 1.81 suggests a high risk of bankruptcy.
- Investors use the Altman Z-score to assess the financial health of companies and mitigate risks, especially when considering investments in companies that may be financially unstable.
4. Portfolio Performance:
- Investors use Z-scores to compare the performance of assets within a portfolio. By standardizing returns, they can easily see how each asset compares to the portfolio average, helping with diversification strategies.
Examples
Example 1: Stock Price Volatility
Suppose you are analyzing the stock of Company A. The average stock price over the past year is $100, with a standard deviation of $5. If the current stock price is $110, you can calculate the Z-score as follows:
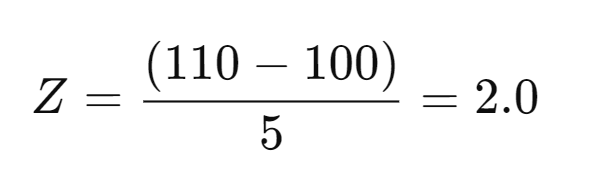
Interpretation: The Z-score of 2.0 indicates that the stock price is 2 standard deviations above its historical average. This could suggest that the stock is currently overperforming compared to its typical range. Investors might view this as a signal to investigate whether the price is justified or overvalued.
Example 2: Investment Portfolio Performance
You are managing an investment portfolio with an average return of 8% and a standard deviation of 2%. A particular mutual fund in the portfolio has a return of 12%. To determine how this fund is performing relative to the portfolio’s average return, you calculate the Z-score:
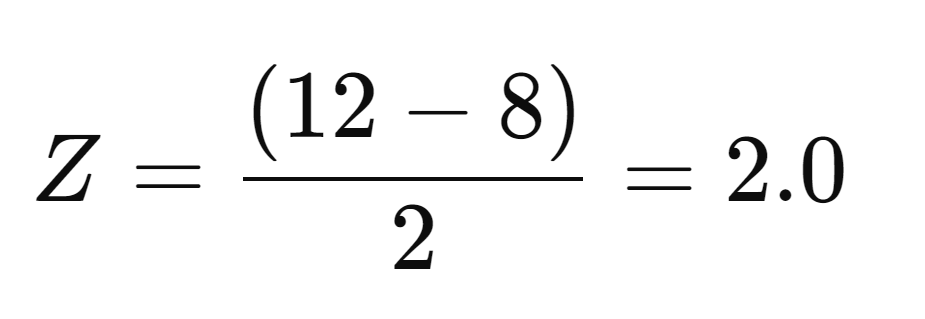
- Interpretation: A Z-score of 2.0 indicates that the mutual fund’s return is 2 standard deviations above the portfolio average. This suggests the fund is outperforming the rest of the portfolio. Investors could explore increasing their exposure to this fund if it consistently performs well.
Example 3: Assessing Bankruptcy Risk (Altman Z-Score)
The Altman Z-score is used to predict bankruptcy risk for a company. Let’s assume you are evaluating Company B, and its Altman Z-score comes out to 1.5.
- Interpretation: Since an Altman Z-score below 1.81 indicates a high risk of bankruptcy, this score of 1.5 suggests that Company B is financially distressed and may face challenges in the near future. As an investor, you may choose to avoid investing in this company or consider selling off any existing shares.
Example 4: Credit Risk of Bonds
You are assessing the credit risk of bonds issued by Company C. The bond prices have an average of $1,000 with a standard deviation of $50. If the current bond price drops to $850, you can calculate the Z-score:
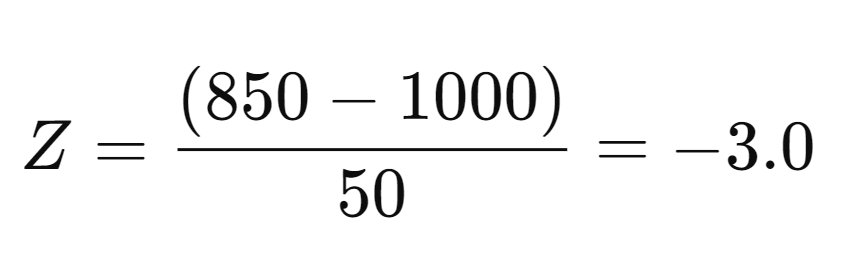
- Interpretation: A Z-score of -3.0 means that the bond price is 3 standard deviations below the average. This sharp drop suggests significant financial instability or perceived risk associated with Company C. Investors might interpret this as a warning signal and reconsider holding these bonds due to elevated credit risk.
Example 5: Comparing Stock Performance Across Markets
You are comparing the performance of Stock X and Stock Y, which are listed in two different markets. Stock X has an average price of $50 with a standard deviation of $5, while Stock Y has an average price of $200 with a standard deviation of $15. Stock X is currently trading at $65, and Stock Y at $220. By calculating their respective Z-scores:
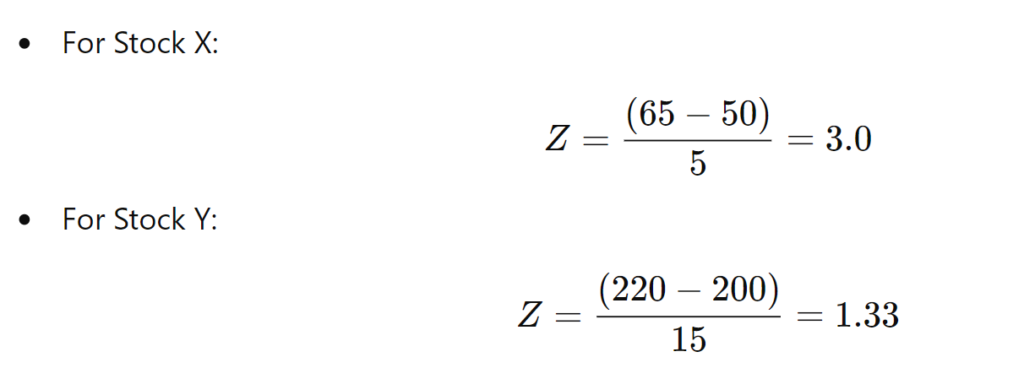
Interpretation: Stock X’s Z-score of 3.0 means it is performing well above its historical average, while Stock Y’s Z-score of 1.33 indicates more moderate performance. Even though Stock Y is higher in absolute price, Stock X is more statistically overperforming relative to its own history. Investors could favor Stock X based on this comparison.
Conclusion
The Z-score is a valuable statistical tool for investors, offering insights into stock volatility, portfolio performance, and financial health. By measuring how far a data point is from the average in terms of standard deviations, Z-scores help identify outliers and make informed investment decisions. Whether you’re evaluating the risk of bankruptcy using the Altman Z-score or assessing the relative performance of assets within a portfolio, understanding how to interpret Z-scores can enhance your ability to manage risk and capitalize on opportunities in the financial markets.